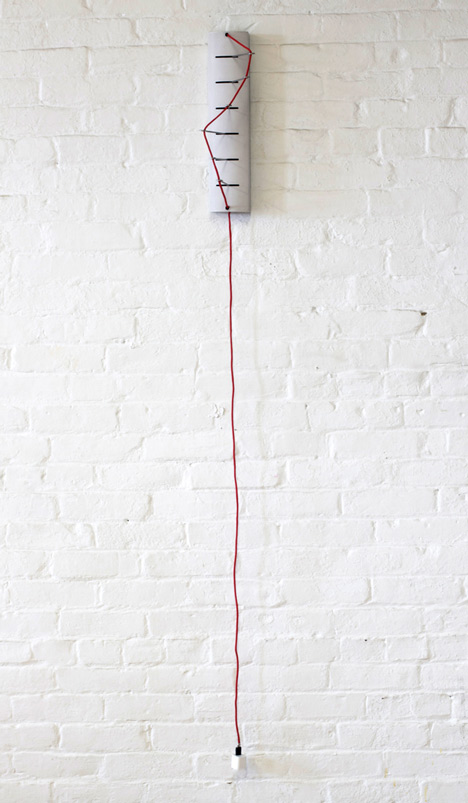
Pulse by Christian Ferrara and Jon McTaggart
Digital data is visualised as kinks in a piece of thread to make an analogue, wall-mounted graph by design students Christian Ferrara and Jon McTaggart (+movie).
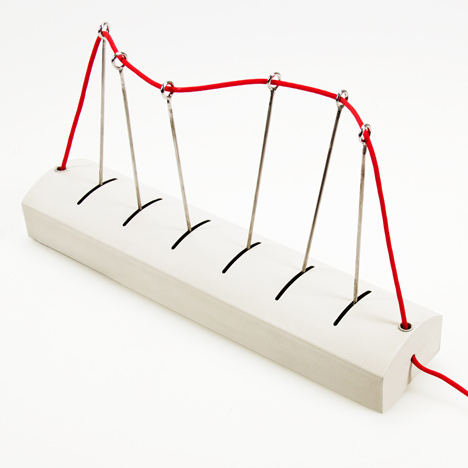
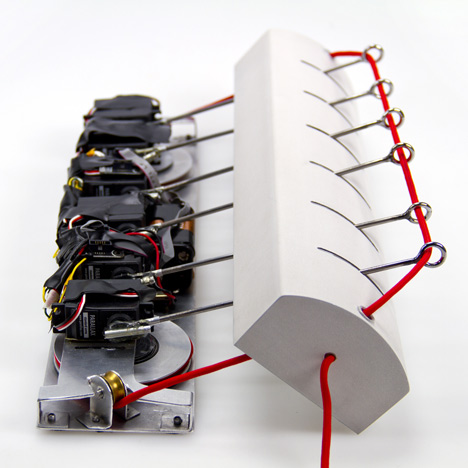
Calling their device Pulse, the students took data output by websites and social networks (Google Weather in the example shown below) and used it to control little motors that move the arms accordingly.
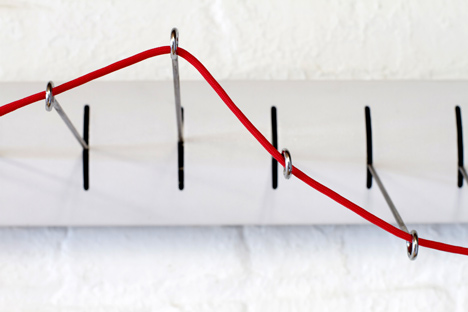
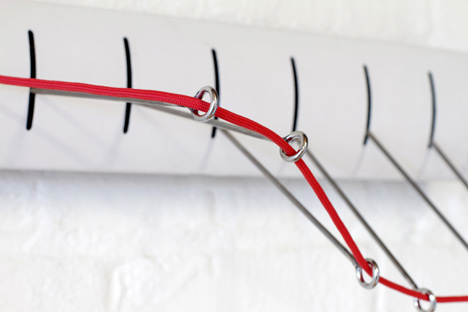
A piece of red cord threaded through the loops at the ends of the arms makes a graph of information that's ever-present on the wall like an analogue clock.
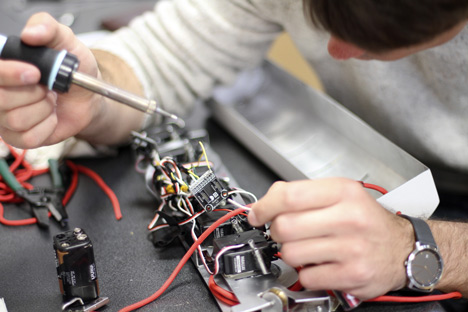
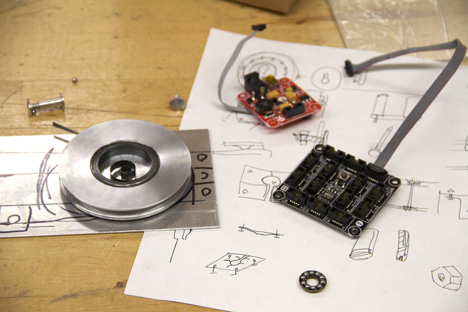
They used an open-source toolkit called Gadgeteer to make and program the device.
McTaggart studies at Köln International School of Design (KISD) and Ferrara studies at Ecole cantonale d'art de Lausanne (ECAL). They met and developed the project while on an exchange semester at the Rhode Island School of Design.
One company working on analogue visualisations of digital data is Hackney studio BERG - check out their Little Printer here.
See all our stories about open design »
Here's some more information from the designers:
Pulse seeks to visualise information in the simplest and most elegant way possible. By using mathematical processing, a wireless internet connection and six servo motors, Pulse converts online information into a tangible graph which is displayed right on your living room wall.
A Wi-Fi capable microprocessor obtains information from websites offering an API (such as Google weather) and processes the information so it is displayed by a series of servo motors. A cord is looped between the servo motor arms and forms a physical graph.
By tilting Pulse users are able to switch between 3 different information feeds of their choice, all of which are easily programmed by pairing the device with its online platform.
With an overload of electronic gadgets and social media platforms, the online generation is being bombarded by information that is irrelevant to their daily needs. Facebook and twitter feeds consume our focus, when in reality, the majority of the data we are being fed does not affect us. Pulse filters out the blur, leaving the user with a clear, pure visual representation of the information they seek.
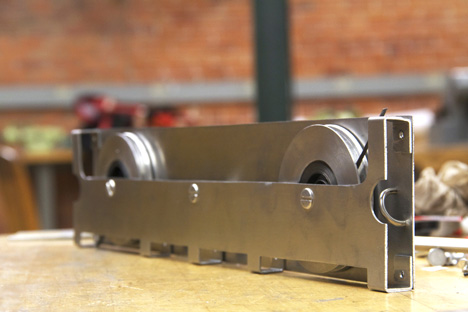
Pulse turns complex information obtained online into an ever evolving tangible graph.
Developed and built during an exchange semester to the Rhode Island School of Design by Jon McTaggart of KISD/Köln International School of Design and Christian Ferrara of ECAL/Ecole cantonale d'art de Lausanne, Pulse uses the Gadgeteer prototyping platform to harvest the web for information feeds and display them in the form of a tangible string graph.
