Second Sea calculator predicts damage to global cities from rising seas
In time for the COP27 climate summit, a team of researchers led by architect Adrian Lahoud has developed an app that calculates how much coastal cities are owed in climate reparations to make up for the destruction wrought by rising sea levels.
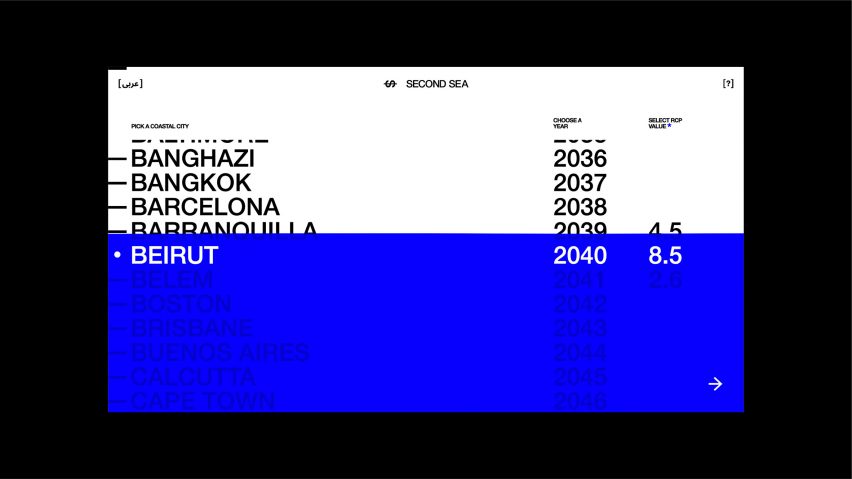
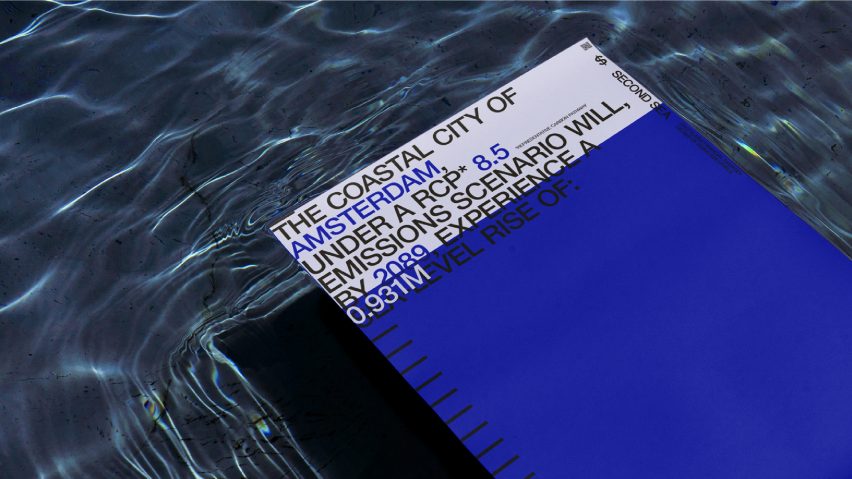
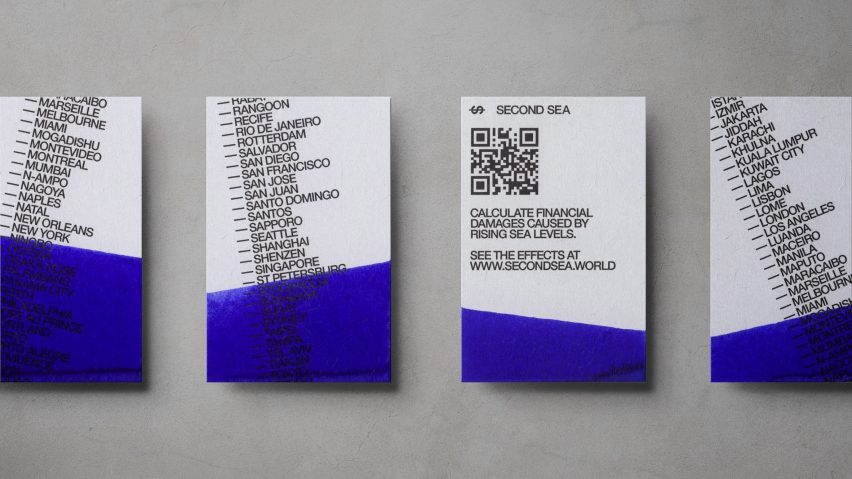
The Second Sea calculator makes use of real-world data from 136 cities from Athens to Zhanjiang, charting what sea level rise they can expect by the end of the century.
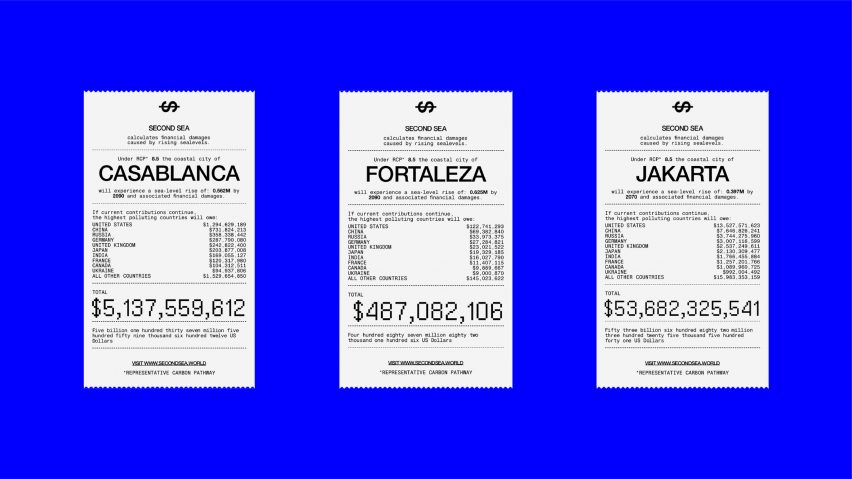
Created in collaboration with Sudanese diplomat Lumumba Di-Aping, design studio Accept & Proceed and developer Made by On, the platform then generates an invoice showing the estimated cost of the resulting damages, which users can share on social media.
The invoice also breaks down what portion of these damages different countries across the world should have to pay, based on their contribution to climate change in the form of CO2 emissions, with the highest-emitting industrialised nations paying the most.
"We want the moral, legal and financial obligation wealthy countries have for paying climate reparations to be recognised at COP27," explained Lahoud, who is the dean of the school of architecture at London's Royal College of Art (RCA).
"Second Sea identifies the historical and projected emissions of those responsible and draws attention to their financial liabilities by producing a nationally itemised reparations invoice, which can be shared as a social media asset."
Poorer countries in the Global South are disproportionately bearing the brunt of the climate crisis, despite being the least responsible and the least financially capable of protecting themselves against the fallout.
Although the topic of richer countries paying reparations for climate "loss and damage" has been under discussion since the 1991 Rio Earth Summit, it has taken until this year for the topic to be added to the formal agenda of a UN climate summit.
"Despite thirty years of discussion and numerous commitments, no significant action to address climate finance has taken place," Lahoud told Dezeen.
"This year at COP27, loss and damage is a formal agenda item for the first time," he added. "Despite this, discussions continue to be held informally and proposals of what nations are responsible and how much they should pay are non-existent."
Lahoud developed Second Sea together with designer Benjamin Mehigan and Sam Jacoby, the research leader of RCA's school of architecture, in a bid to push the reparation agenda forward.
The resulting app, designed in collaboration with Accept & Proceed and realised by Made by On, looks specifically at the topic of rising sea levels, which could cause flooding and damage to the tune of $14 trillion a year come 2100 if emissions continue as they are.
"We have focused on sea level rise and coastal cities for this iteration of the platform because that is where we have the most robust data," Lahoud explained.
"Sea level rise will lead to the displacement of communities, loss of wetlands, reduced biodiversity, flooding, subsidence and increased salinity, and will disproportionately burden future generations and those in already vulnerable developing economies with debts and harms not of their own making."
Sudanese diplomat Di-Aping, the former chair of the G-77 group of developing countries, worked with the researchers to create a model for how the reparation payments should be determined.
Unlike current environmental law, which generally requires victims to prove a direct cause-and-effect relationship between pollution and any resulting damages, the researchers suggest a system grounded in a country's proportional contribution to climate change.
This is determined based on the nation's cumulative historical CO2 emissions up to the present, assuming that they will continue as they are.
"CO2 is long-lived, and it is fairly evenly distributed in the atmosphere," Lahoud said. "That 'evenness' opens up new spaces of legal activism that moves away from attribution as a causal relation to attribution as a proportional contribution."
"In other words, if a nation has contributed 15 per cent of global CO2 emissions, it is responsible for 15 per cent of loss and damage caused by climate change everywhere and for everything."
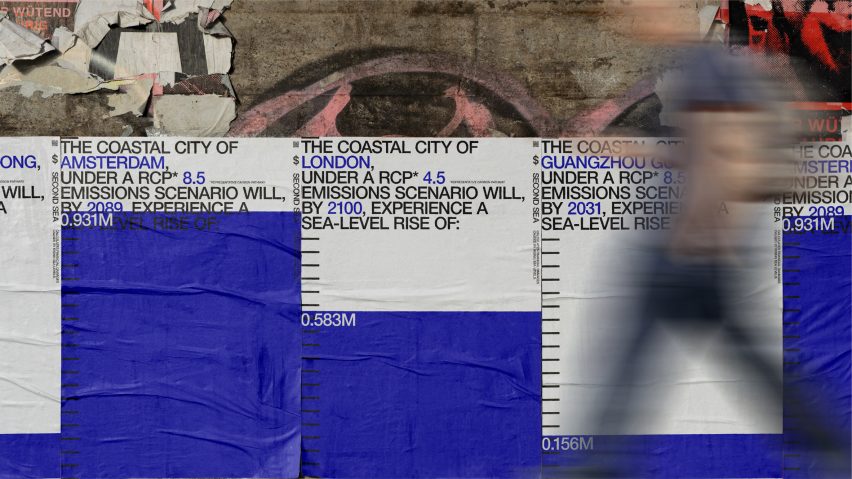
On the Sea Change platform, the sea level rise for different cities is visualised in the form of a wavy blue bar, which takes over the results page and can be toggled up or down to scroll through the years from now to 2100.
"The deep blue graphic gives the impression of flooding the screen, of being immersed in this mighty sea, obliterating everything in its path," explained Accept & Proceed's executive creative director Matthew Jones.
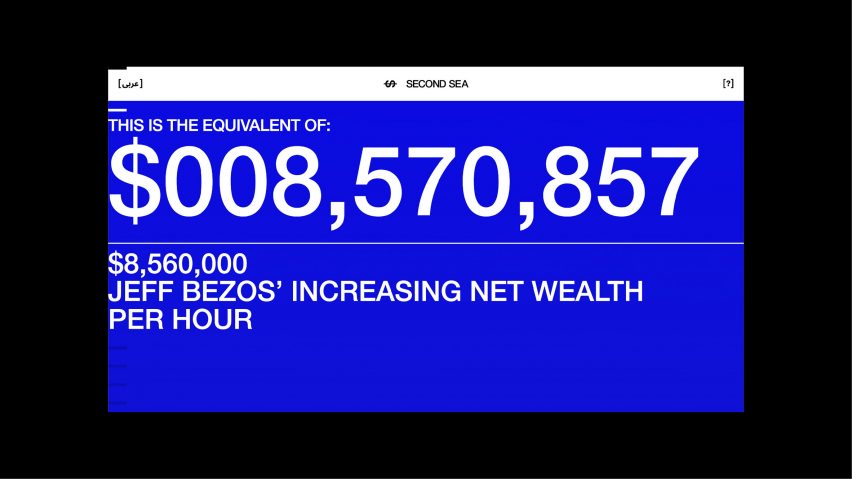
As users scroll down the page, the app also breaks down how a city's financial damages would increase with the rising waters, providing real-world monetary comparisons to make these sums feel more tangible.
"It's incredibly hard to fathom the difference between ten million and five billion, they're all just big numbers," Jones said.
"Within the platform, we contextualise what these mean in real terms, such as Jeff Bezos's wealth increase over a day or the cost of hosting the Eurovision song contest."
Climate change can often feel like an unfathomable problem. But designers are finding new ways to visualise data about global warming in the hopes of making it more understandable – and ultimately inspiring climate action.
Recent projects in this space include a font designed by Helsingin Sanomat that shows the decline of Arctic sea ice in its disappearing letterforms and a range of blankets and scarfs by Dutch design studio Raw Color, which features infographics about rising temperatures while providing a way to keep warm without turning on the heating.
Dezeen is on WeChat!
Click here to read the Chinese version of this article on Dezeen's official WeChat account, where we publish daily architecture and design news and projects in Simplified Chinese.